Blog
-
Dumping complex infrastructure for scripts and a(nother) new online collection
I feel doomed (complimentary) to write these posts every few years about rebuilding an online collection. Maybe that’s because they’re always glued together, always better than what came before but simultaneously still a messy bridge between systems. This is by my count the 3rd major new online collection I’ve worked on for the Whitney, on top of an untold number of smaller tweaks and rewrites. Sometimes there’s big new features this enables (see: portfolios, high resolution images, exhibition relationships), and sometimes, like this time, it’s quieter (see: better colors in images, verso titles). I think it’s important to acknowledge this work while also understanding that it is the kind of non-flashy, incremental improvements that are difficult to grab attention for, and despite the evidence hard to always write about…
-
Bird App hits the web
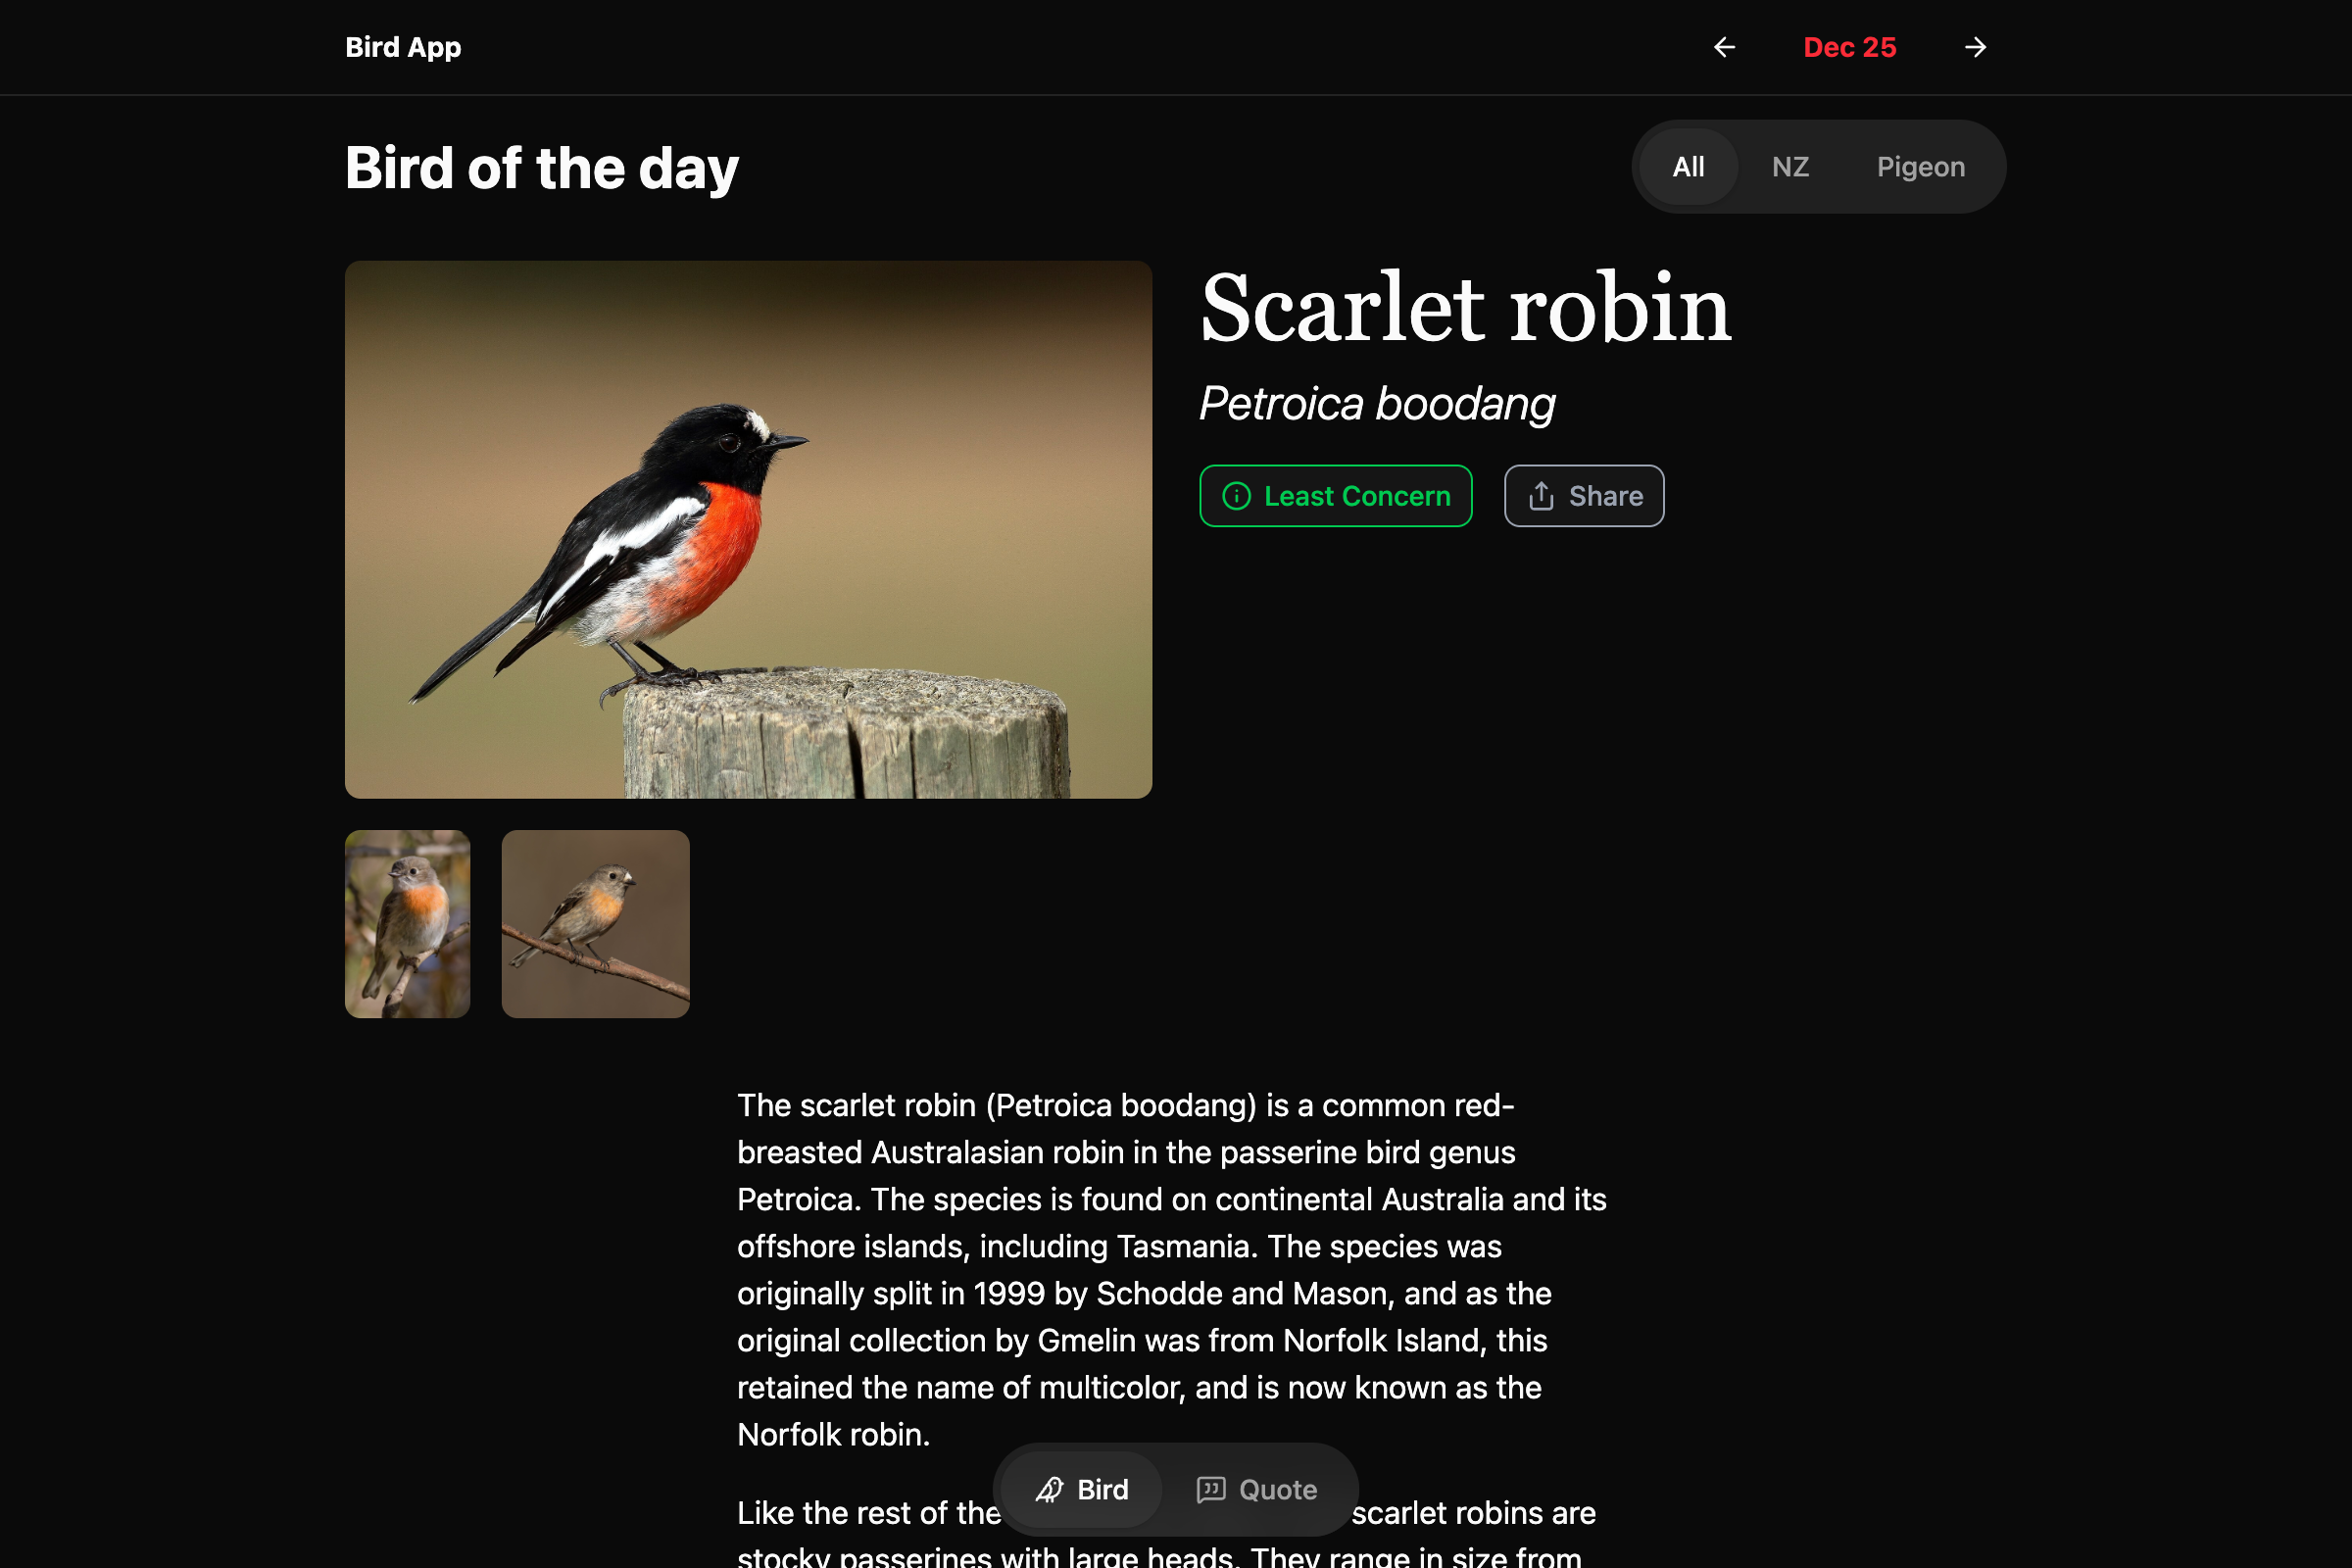
The original Daily Bird app was architected with no back end: each instance of the app would call Wikipedia and Wikidata on its own and save that data locally on the device. I did that because I didn’t want to set up a bunch of infrastructure or sign up with some SaaS option that might be gone in a year. It never really made sense if I wanted to expand things to the web or Android, where it would be extremely helpful to be able to point to a single source of [bird] truth…
-
I made an API and now it gets 200k+ requests a month
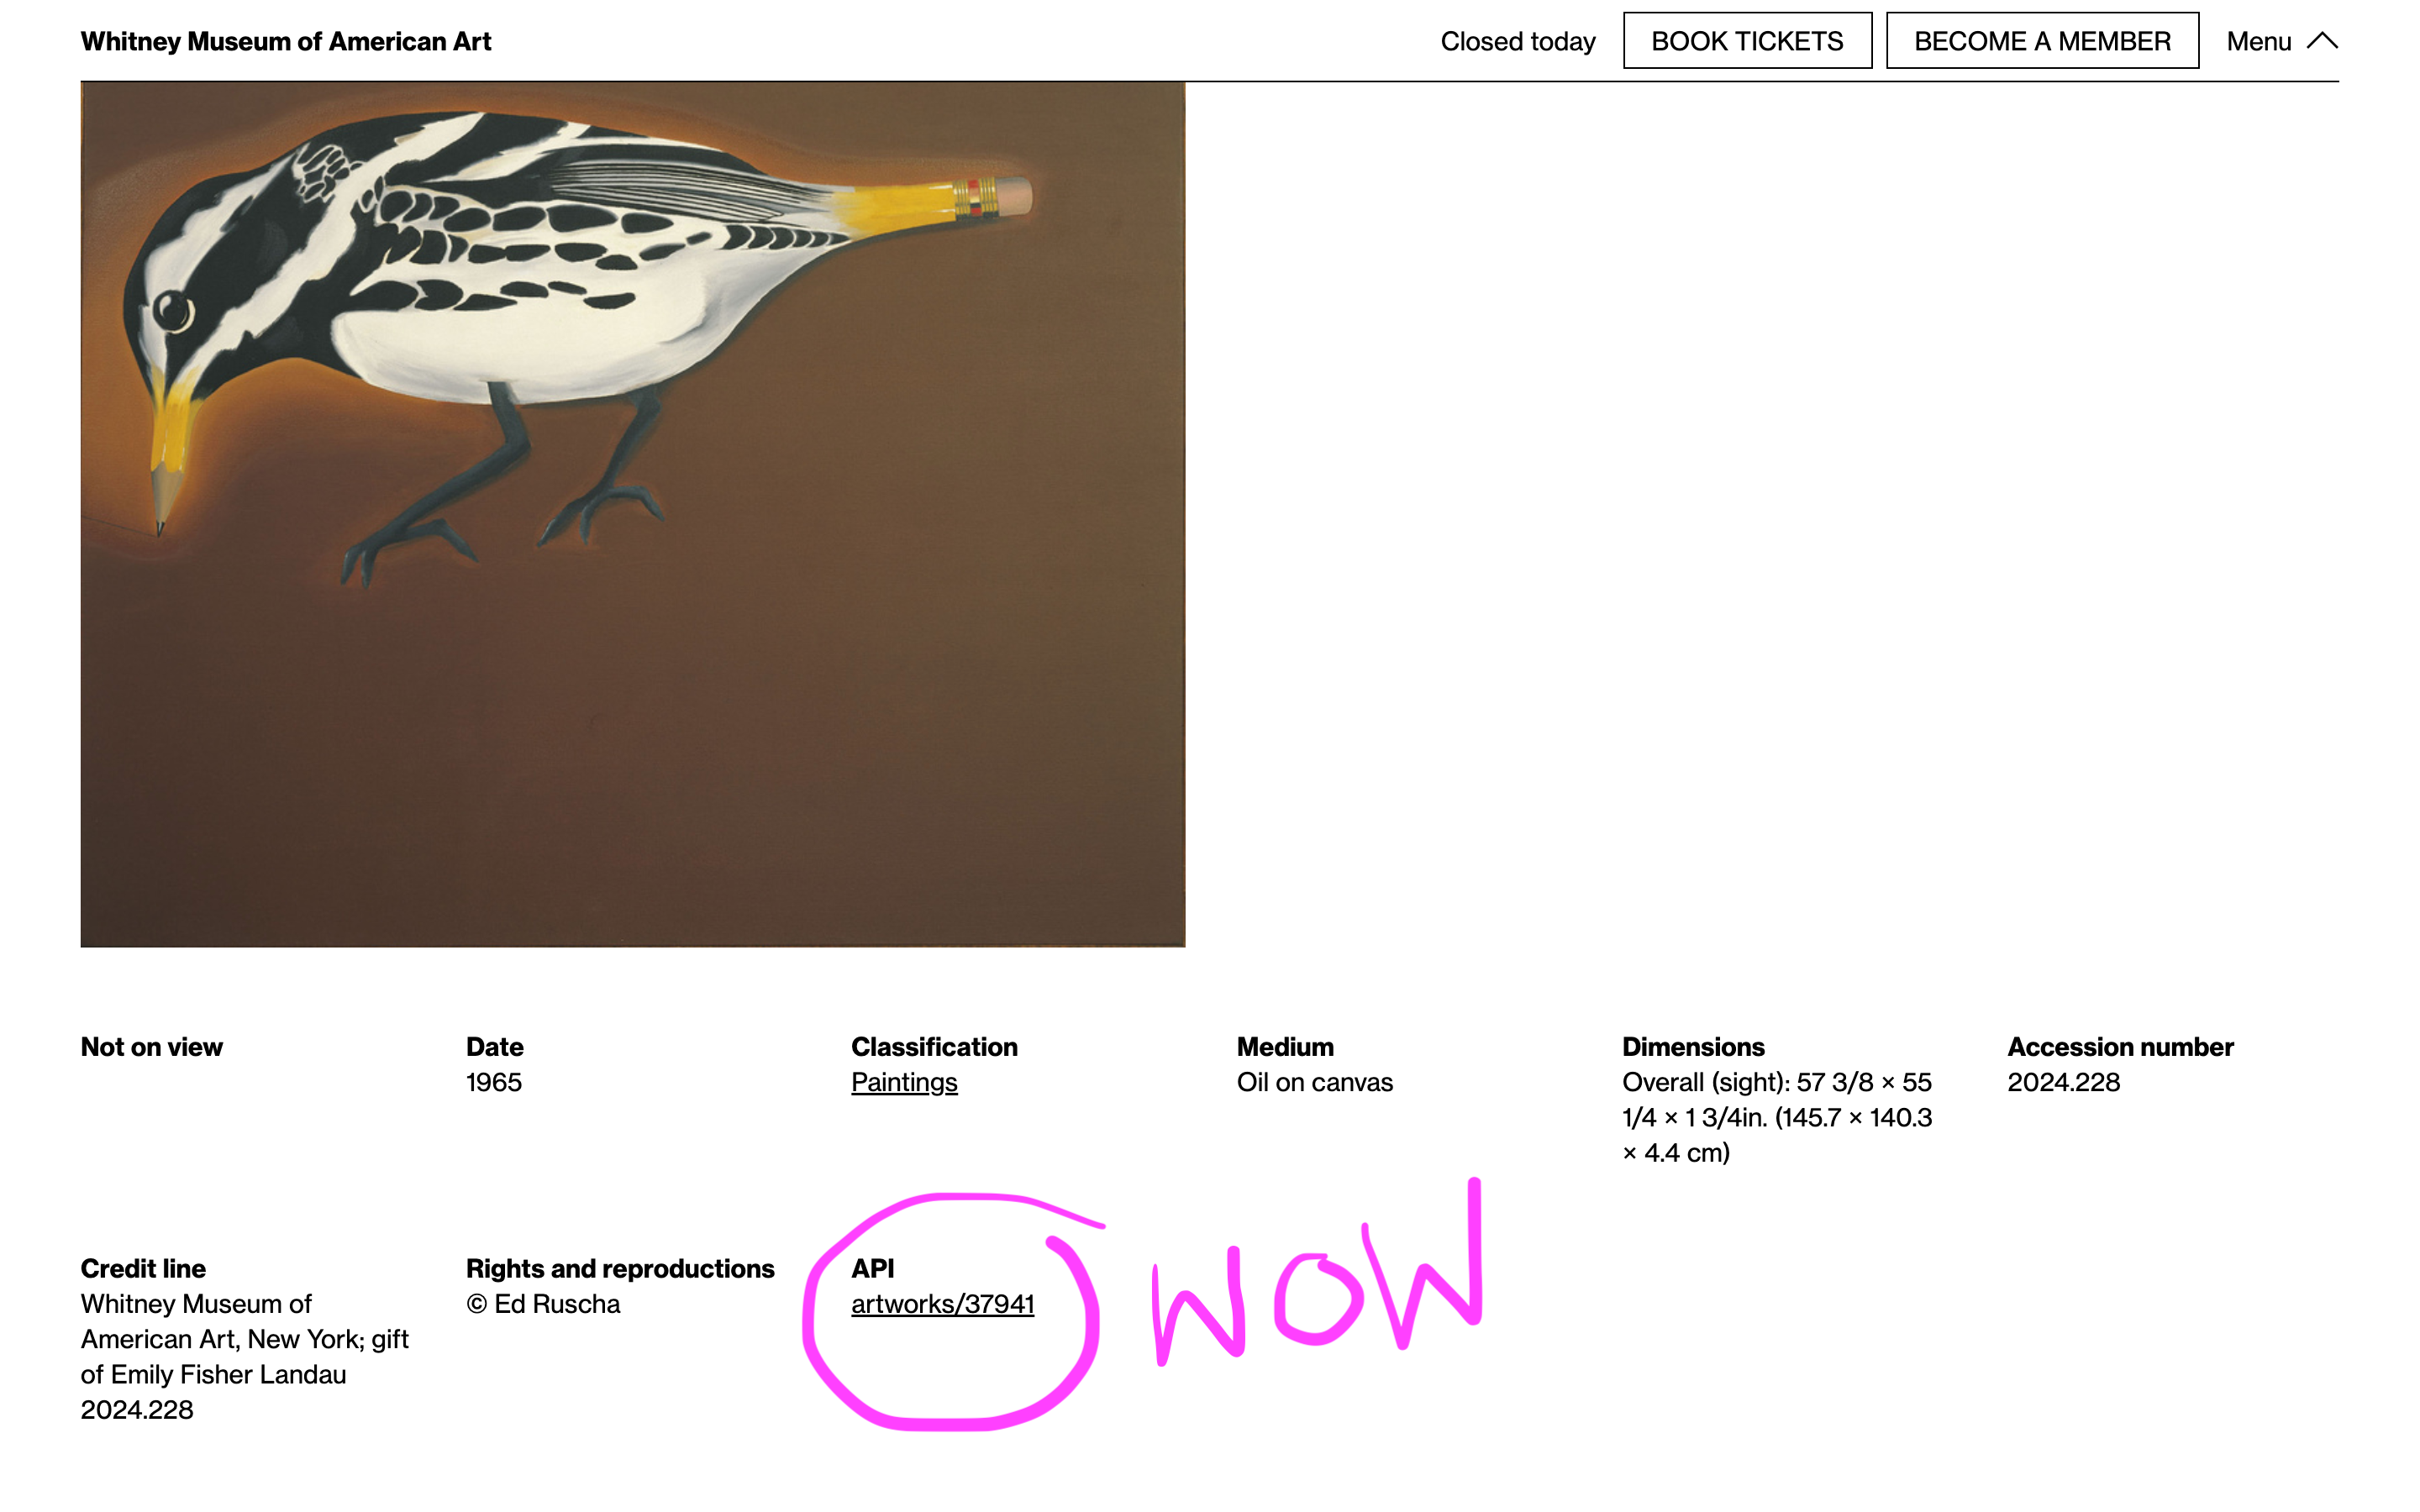
Having an API always made sense for the museum. An API provides structured, always up to date, machine-readable access to our public data that complements our existing flat file Open Access datasets. The challenge was always a) how feature rich does that API need to be and b) can we include enough material to make it useful…
-
![A possum with it's mouth open with the caption, Your art does not meet Guideline 4.2.1 Minimum Functionality, followed by [Screaming beings].](https://colinbrooks.com/wp-content/uploads/2025/01/possum_rejection.jpg)
App stores and museums
A couple months ago I had the pleasure or burden of releasing either the first apps ever, or the first apps in the last decade for the Whitney Museum. Working with Steven Fragale we revived Sapponckanikan, an app he and Alan Michelson released and first showed at the Whitney in 2019 as part of Wolf Nation…
-
Keyword tagging artworks with GPT4 and Google Vision
I have no data to back this up (a great way to start a blog about data), but I think when people visit a museum’s online collection there are two kinds of things they’re likely to type in a search box if you give them the chance 1) something specific and relevant to that collection 2) an animal they like. For somewhere like the Whitney the former is largely solvable with existing metadata, but the latter presents a real problem. How do you tag a constantly growing collection of tens of thousands of objects with terms that may also shift and change over time? The answer might ideally be “carefully” and “with actual people”, but this is Museums and everyone is already busy…
-
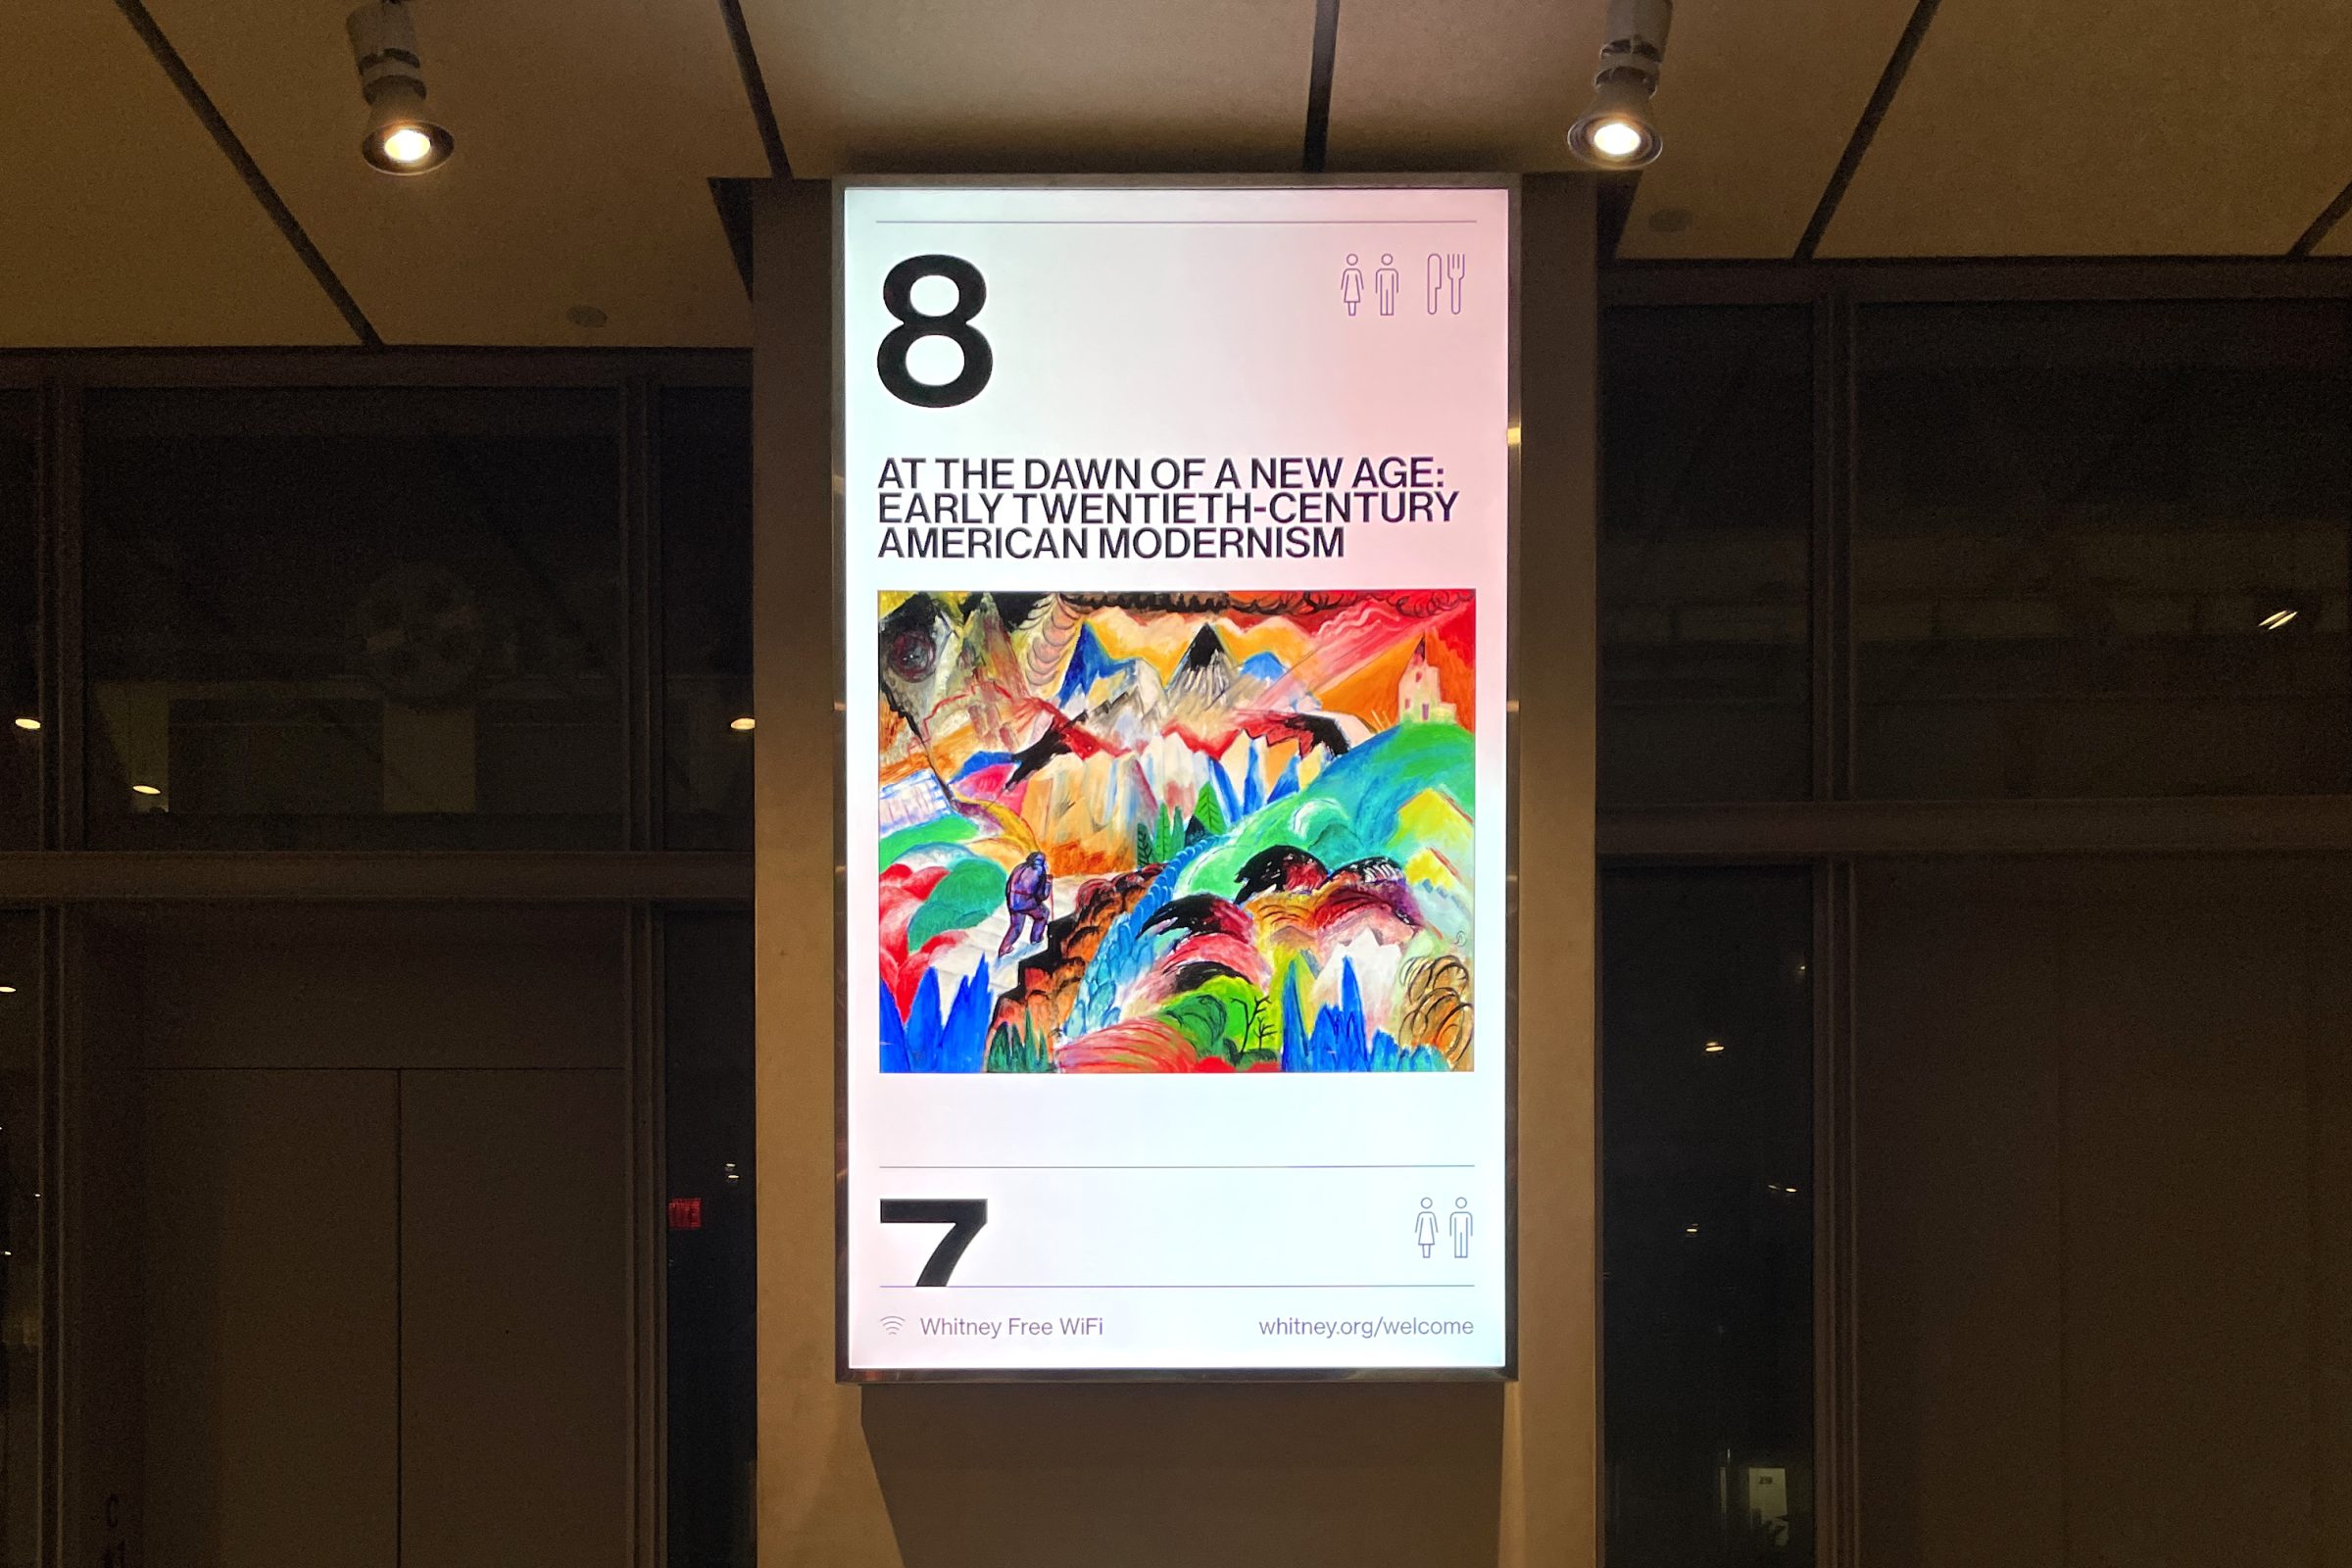
Rebuilding digital signage at the Whitney
It’s webpages. The museum’s new digital signage system is webpages…
-
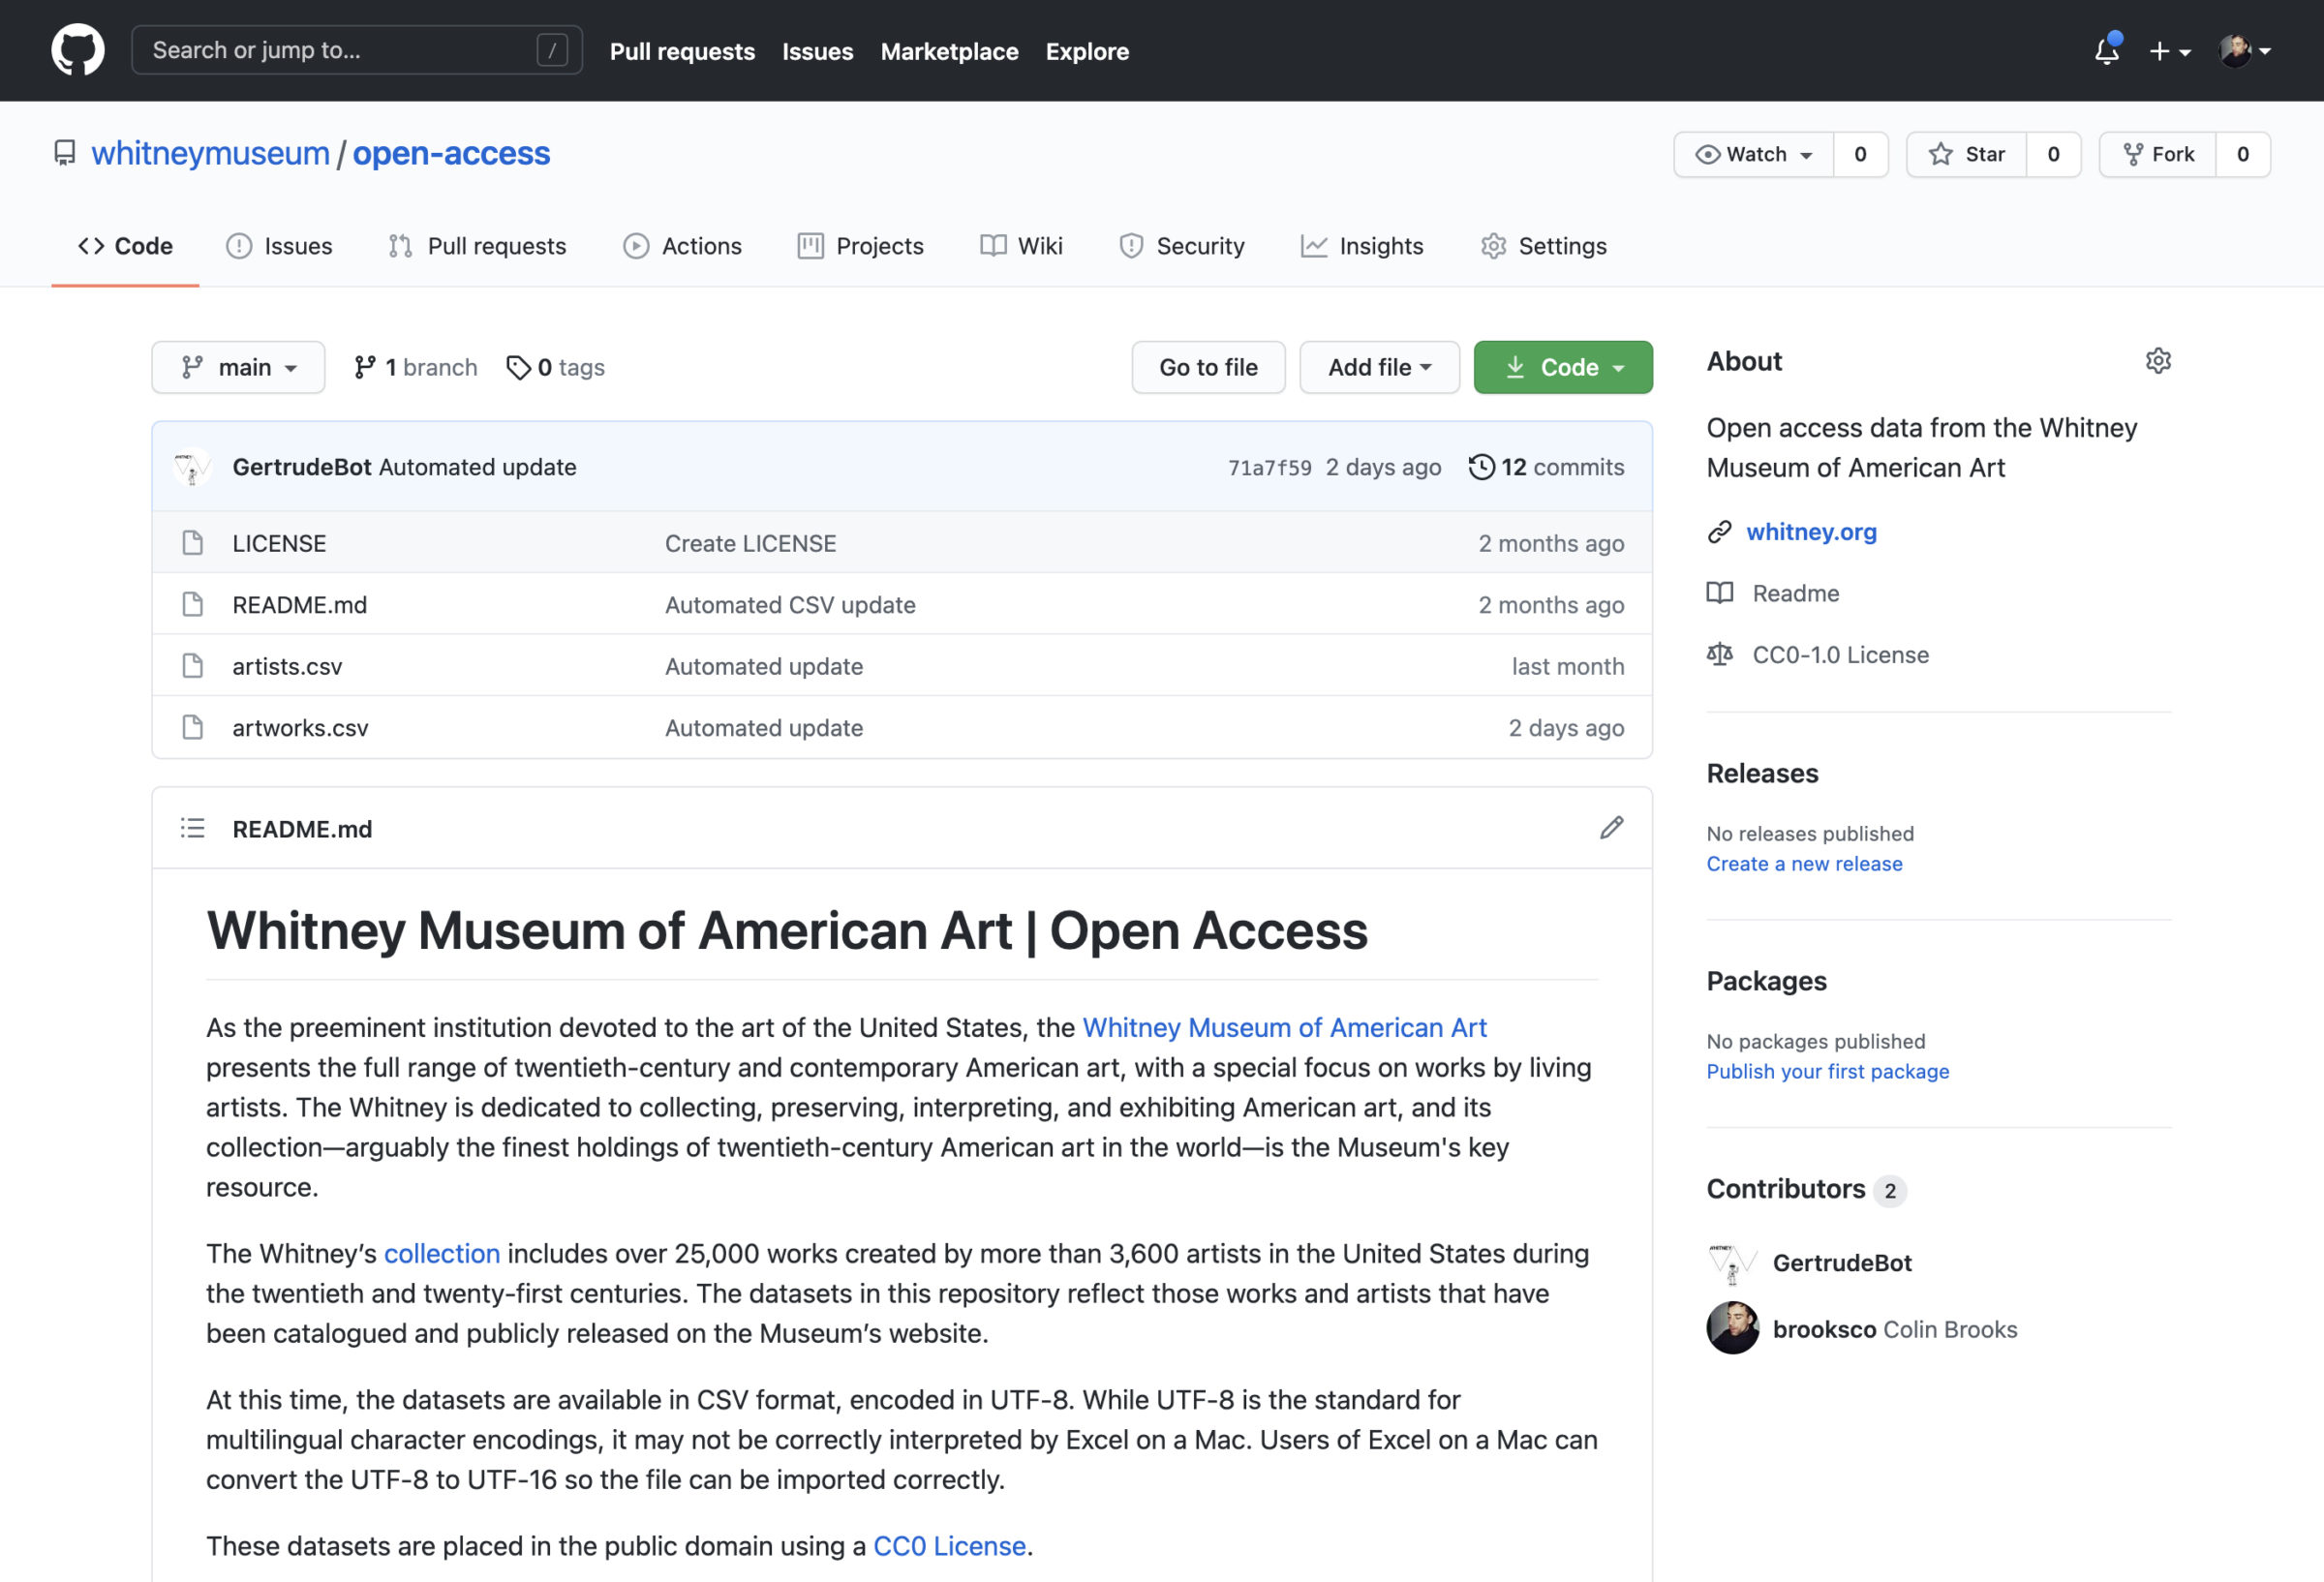
Stepping into open access
This is what we are here for, as a sector: To make the results of human creativity from all times and all corners of the world accessible to all citizens, to foster new knowledge and inspire new creativity…
-
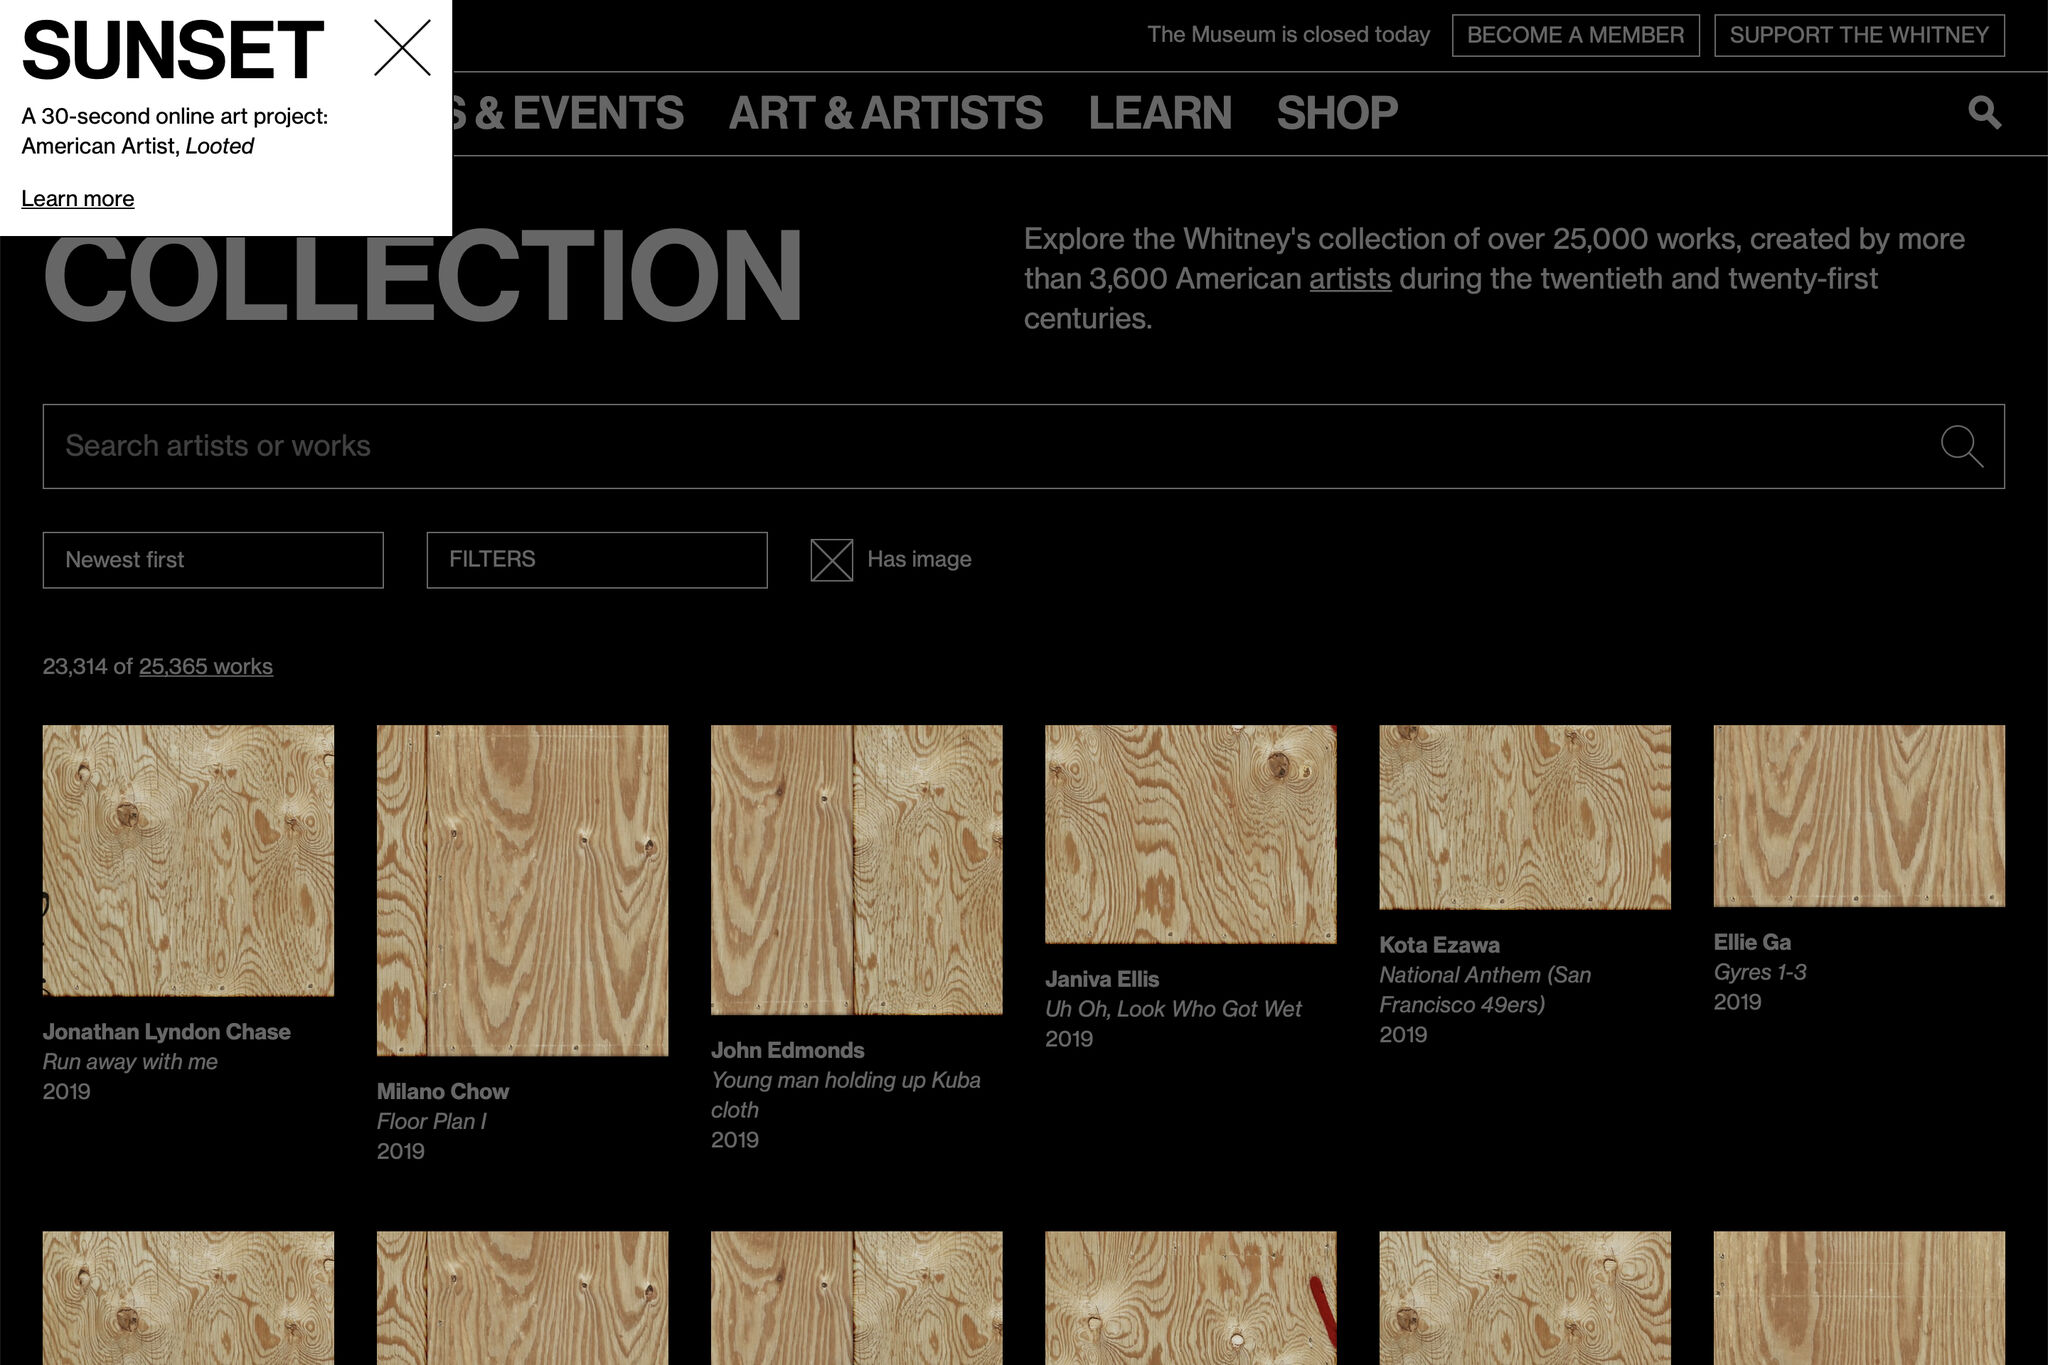
Sunrise/Sunset and letting artists take over the museum
Recently we published a new Sunrise/Sunset on whitney.org by American Artist, called Looted. The artist and project has been written about elsewhere, and while the most important thing I can say is go check it out, I think it’s also a good moment to talk about why Sunrise/Sunset is such an important, and unique series…
-
Relaunching the Whitney’s Online Collection…again
*Author’s note: I’ve been sitting on a half-finished draft of this for too long, and while I know this is a bit of an odd time to share, I have very little else to do. I hope that these kinds of online museum resources can be a positive outlet for boredom and inspiration in the weeks and months ahead.*
-
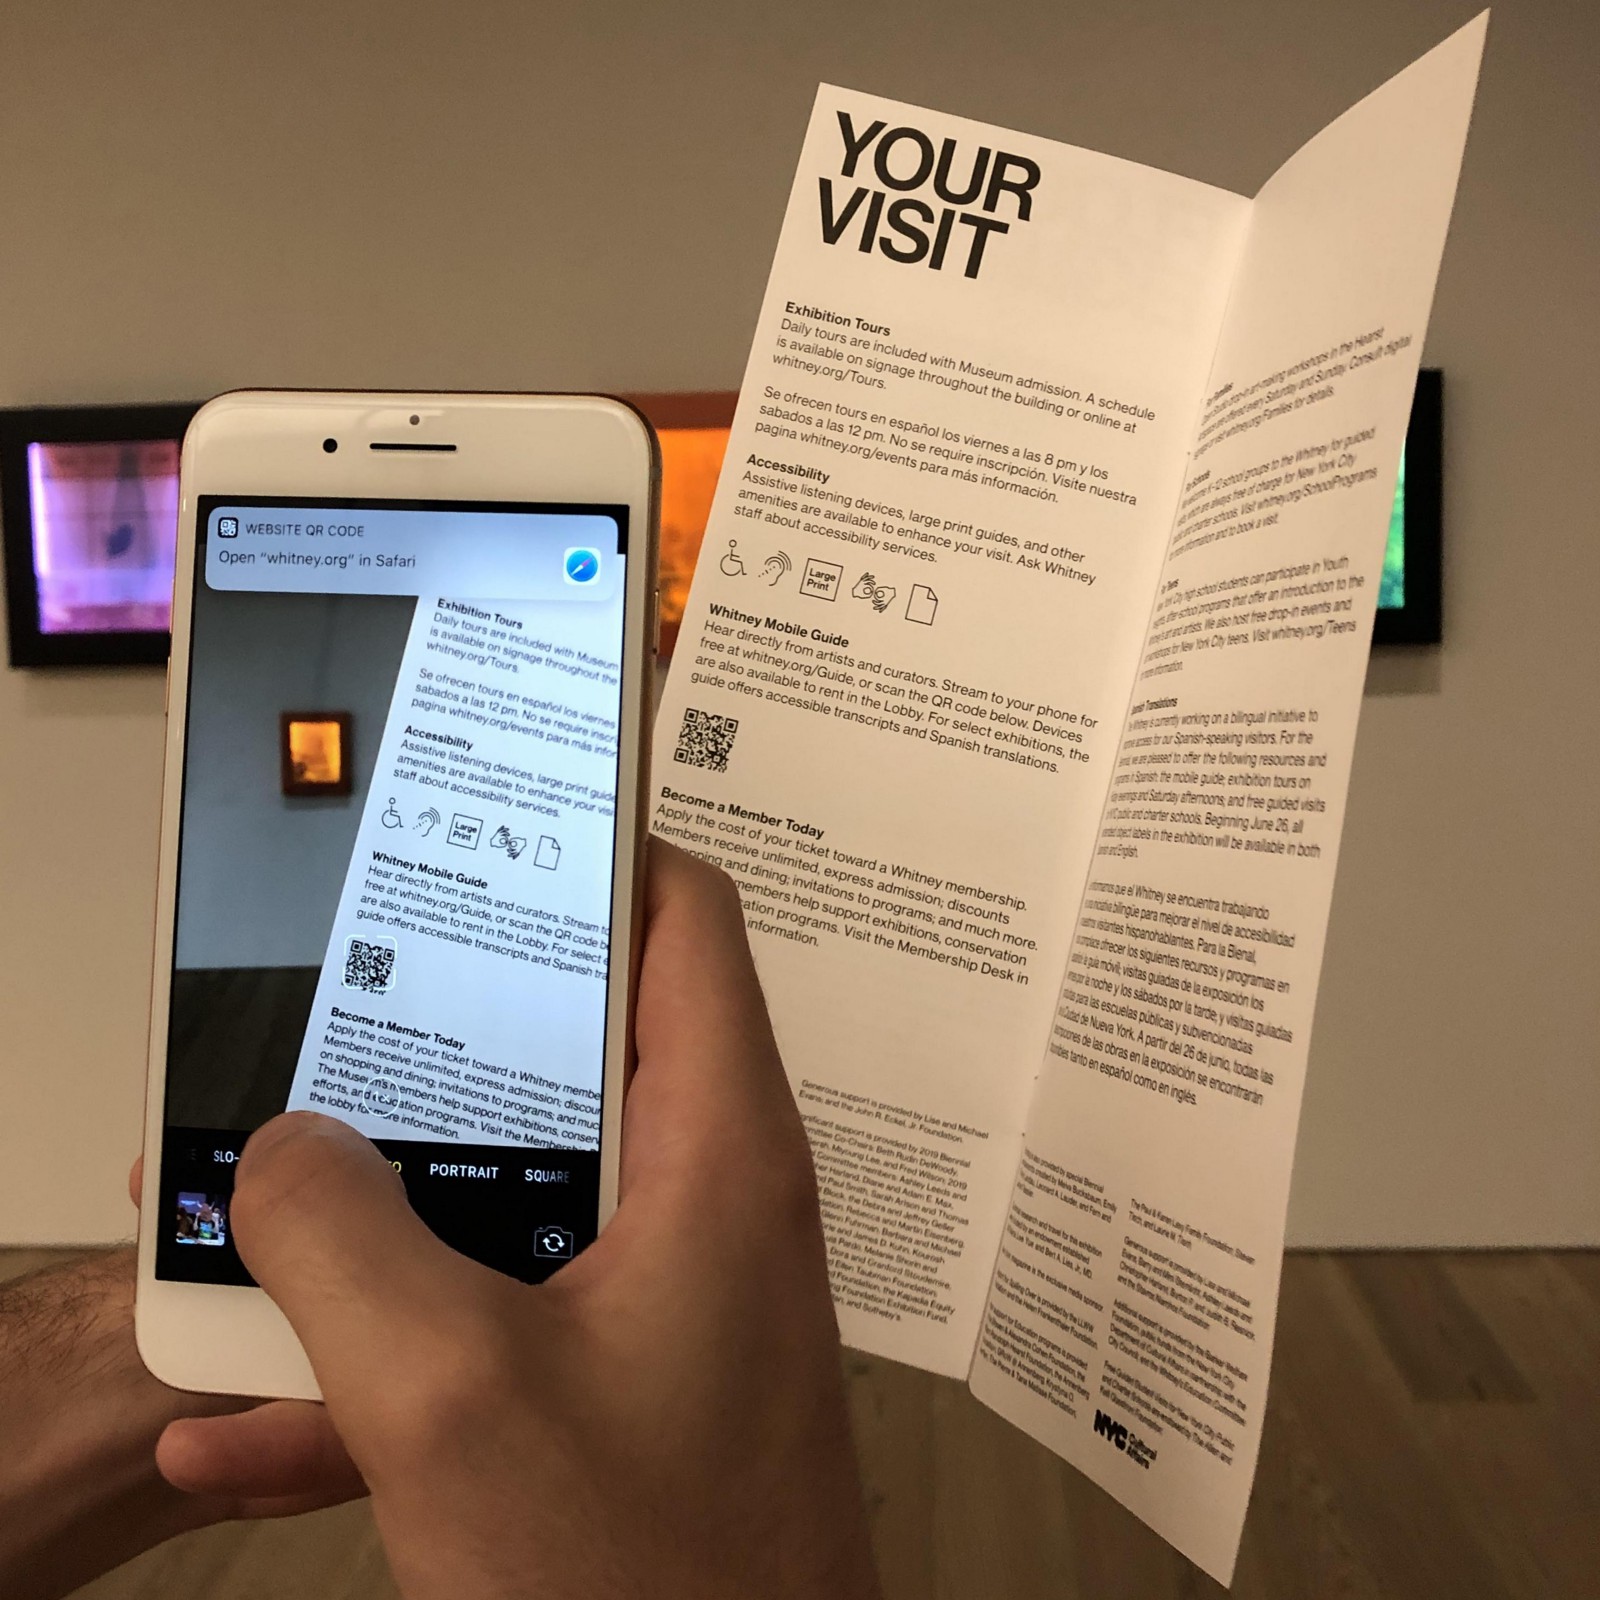
QR Codes: Alive and Well in the Museum?
I can’t tell you if QR codes are dead, undead, or if they never died in the first place, but I can tell you we’ve been trialing them at the Whitney Museum of American Art over the last year. Anecdotally, everybody familiar with what QR codes are seems to have an anecdote about them, but we wanted to determine more systematically whether or not they might be a useful tool for driving visitors into digital content while at the Museum, with any meaningful levels of utilization. And as it turns out, for us, QR codes are alive and well…
-
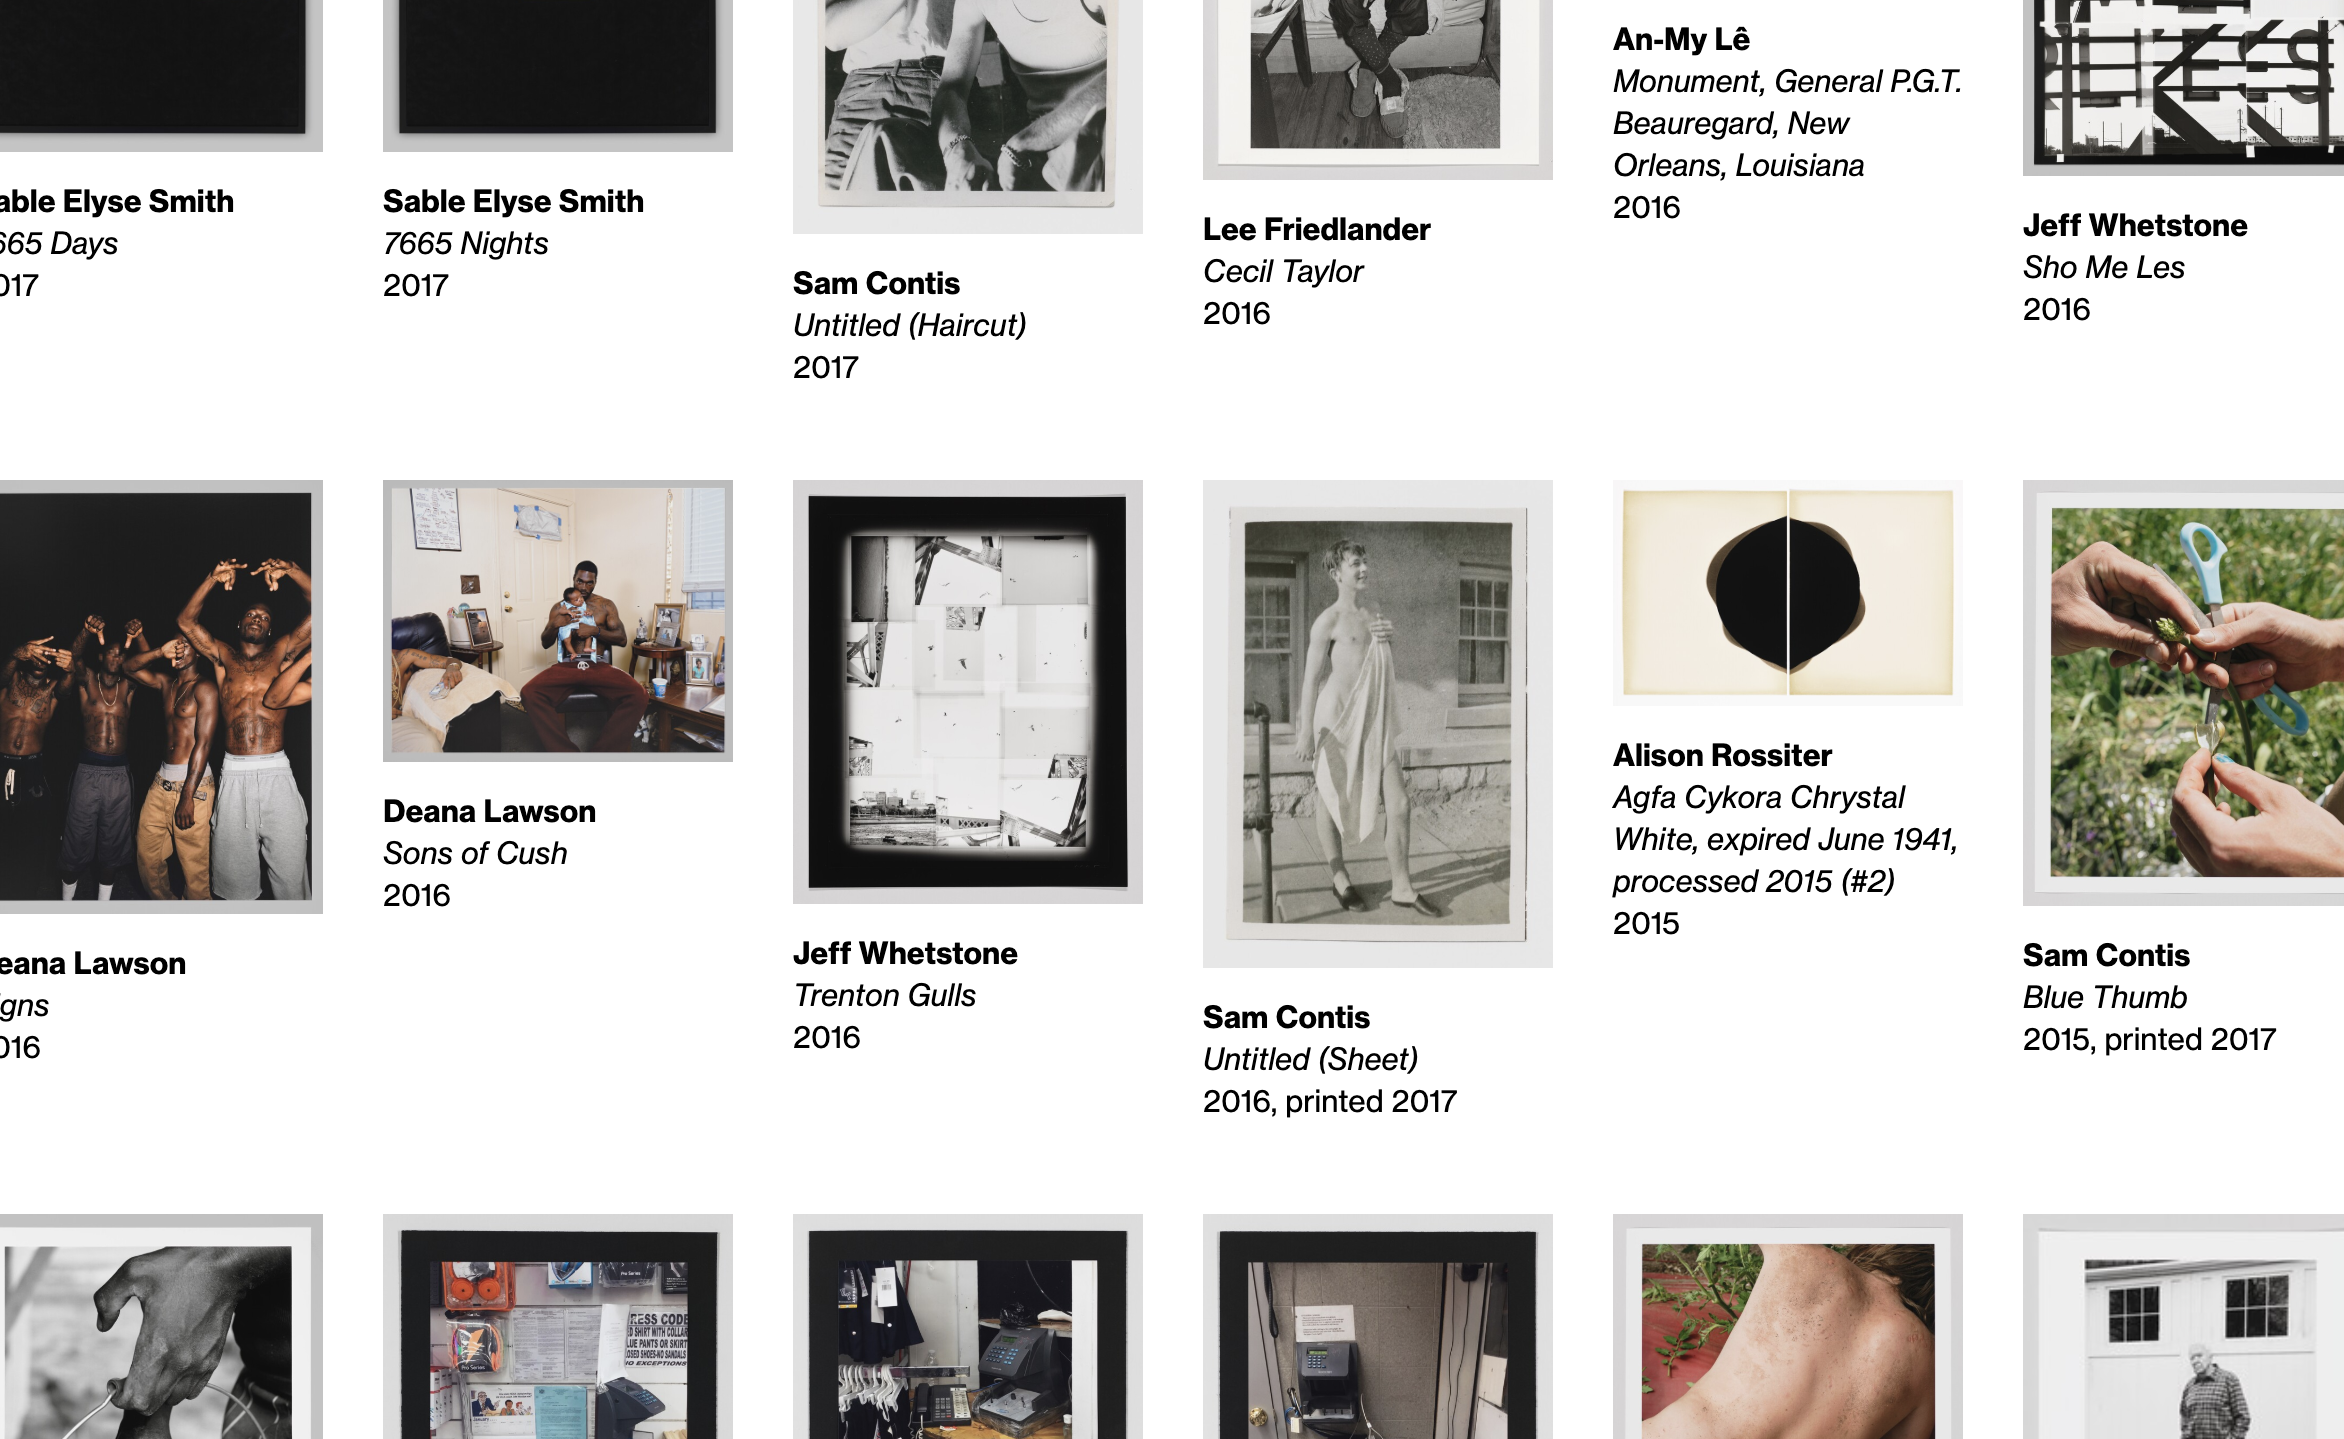
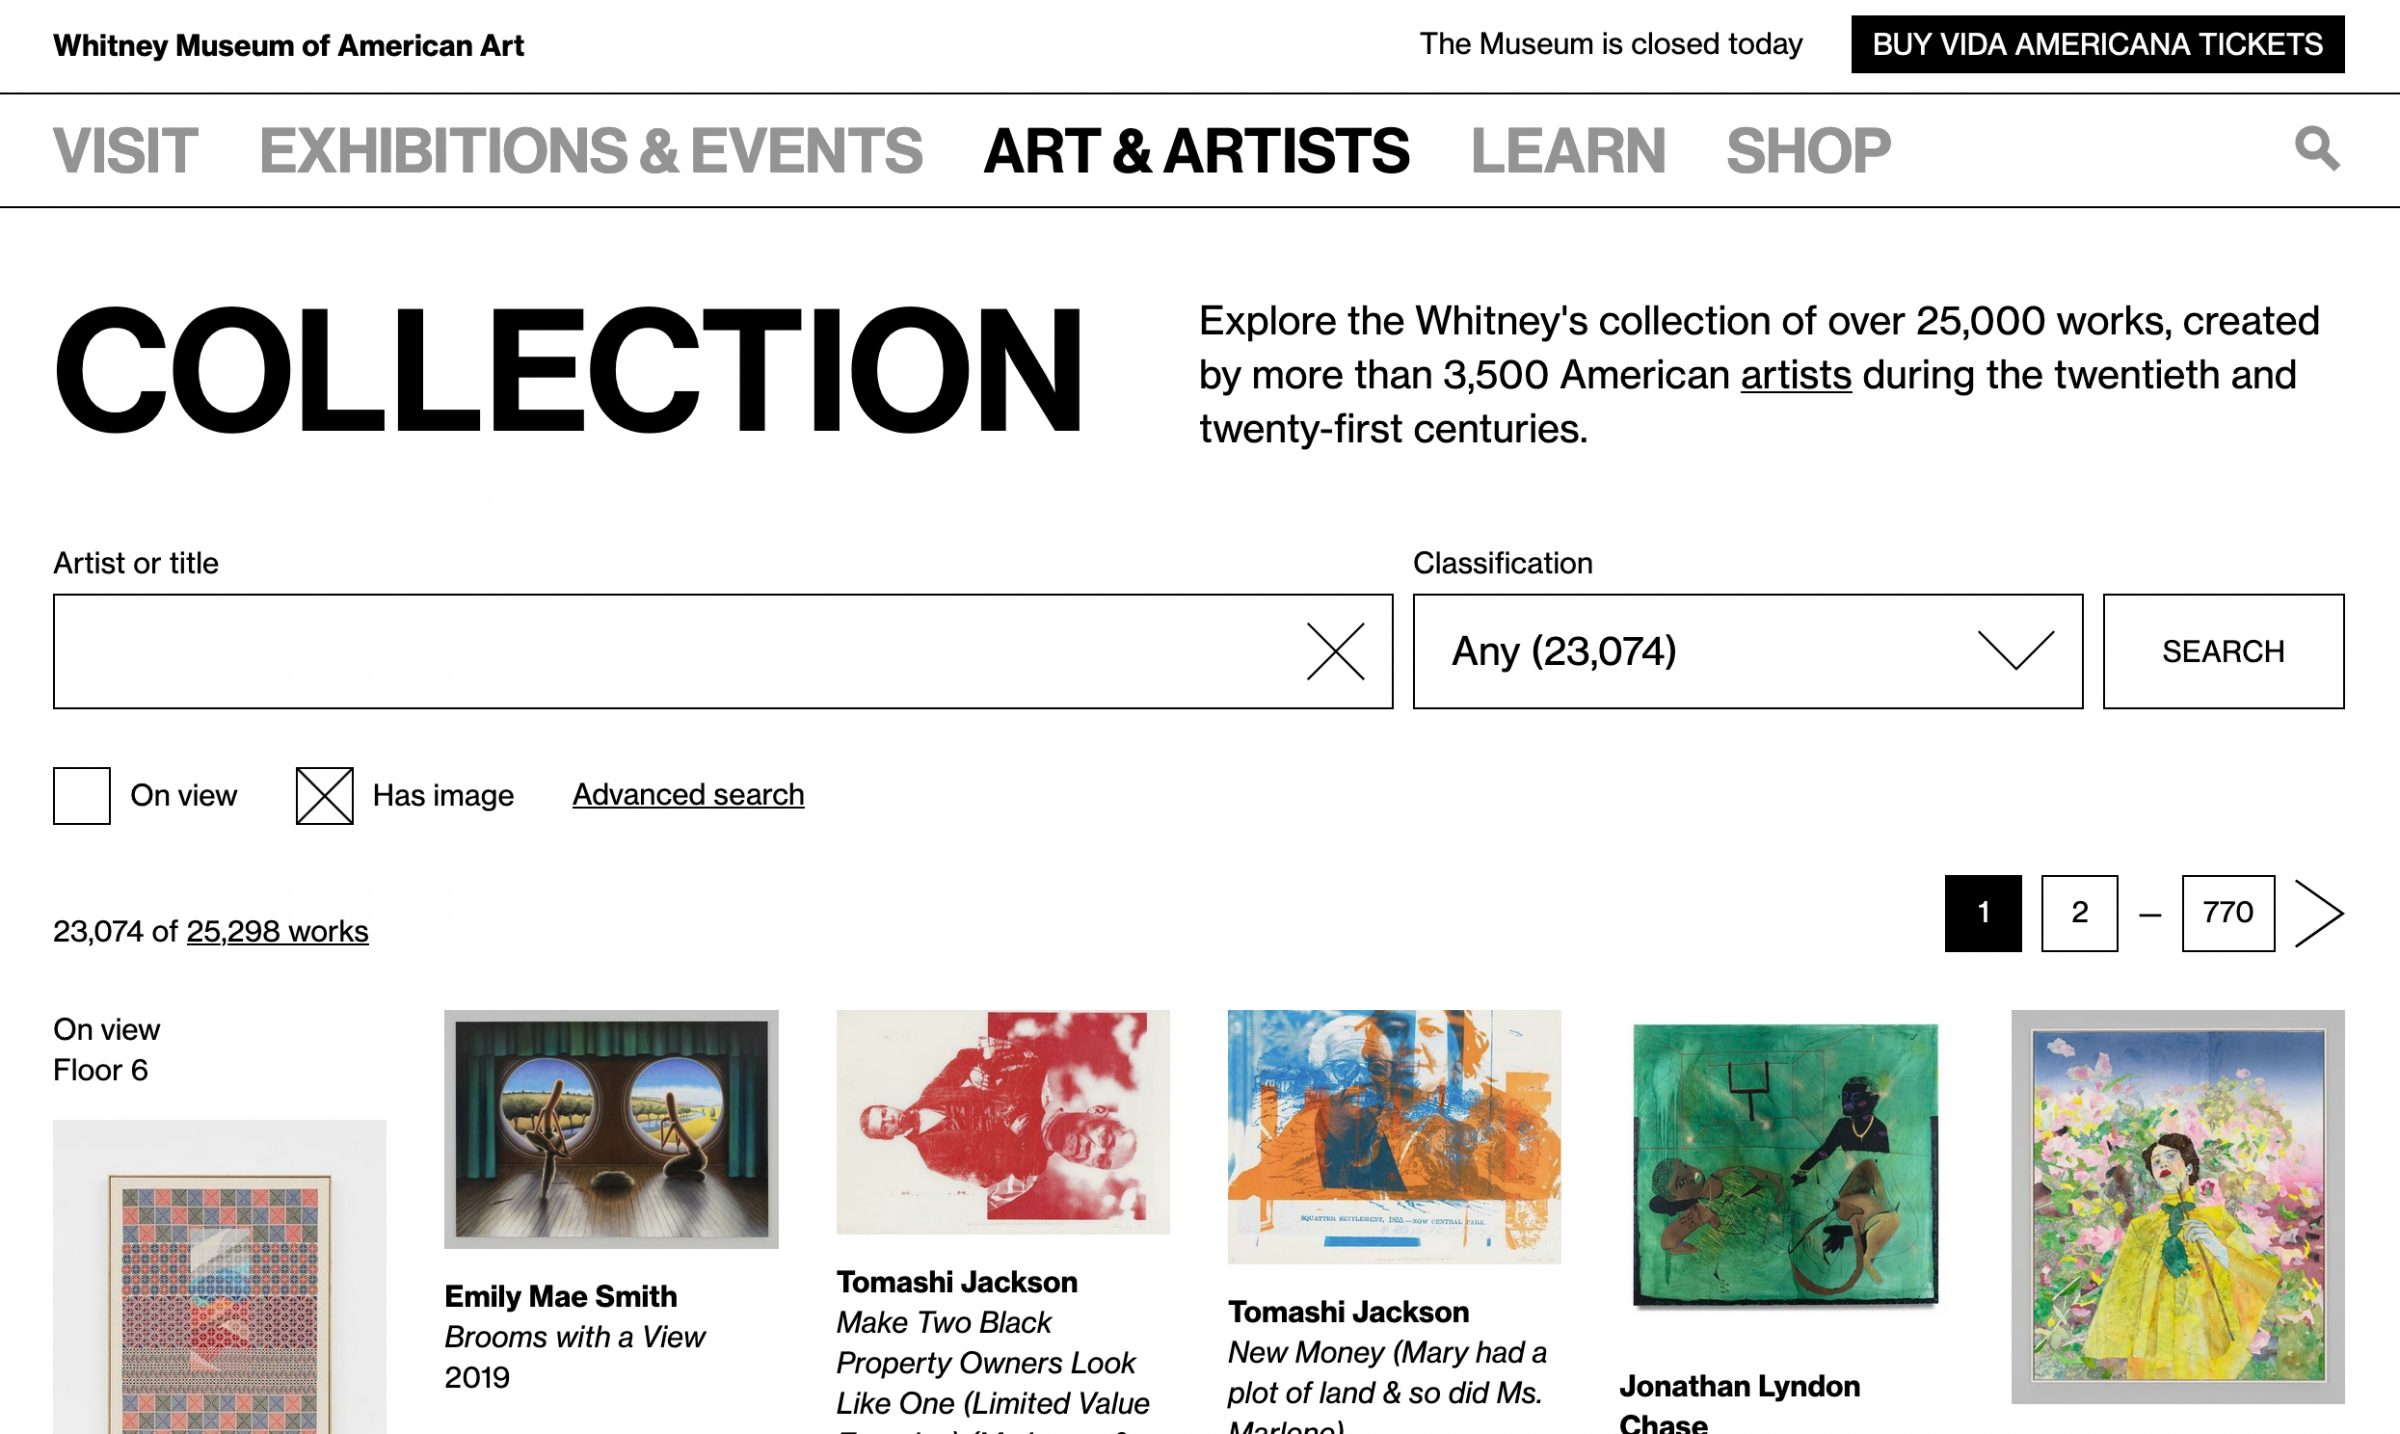
Relaunching Softly: the Whitney’s Online Collection
The Whitney’s collection defines and drives much of our mission and our work. It is a unique resource, offering a lens into the historical and contemporary landscape of American art through more than 3,400 artists and 23,000 works of art. With the opening of the Whitney’s new building in 2015, nearly every work in the Museum’s collection was made available online for the first time…
-
Dimensions of Museum Data
Google analytics was not built for the arts. Most of the time that’s fine: as a museum we still care about all kinds of standard metrics. Pageviews still matter, session behavior matters, referrals matter, ecommerce matters, and when we need something specific to our platform or its extensions we can usually cover it with custom event tracking or find another tool that can give us what we need. But as we’ve tried to more cohesively analyze data around our exhibitions, it’s become more and more labor intensive to identify the throughlines between content spread across different aspects of our online presence. There are a number of ways we’re working to answer this challenge, and one is through better utilizing custom dimensions…
-
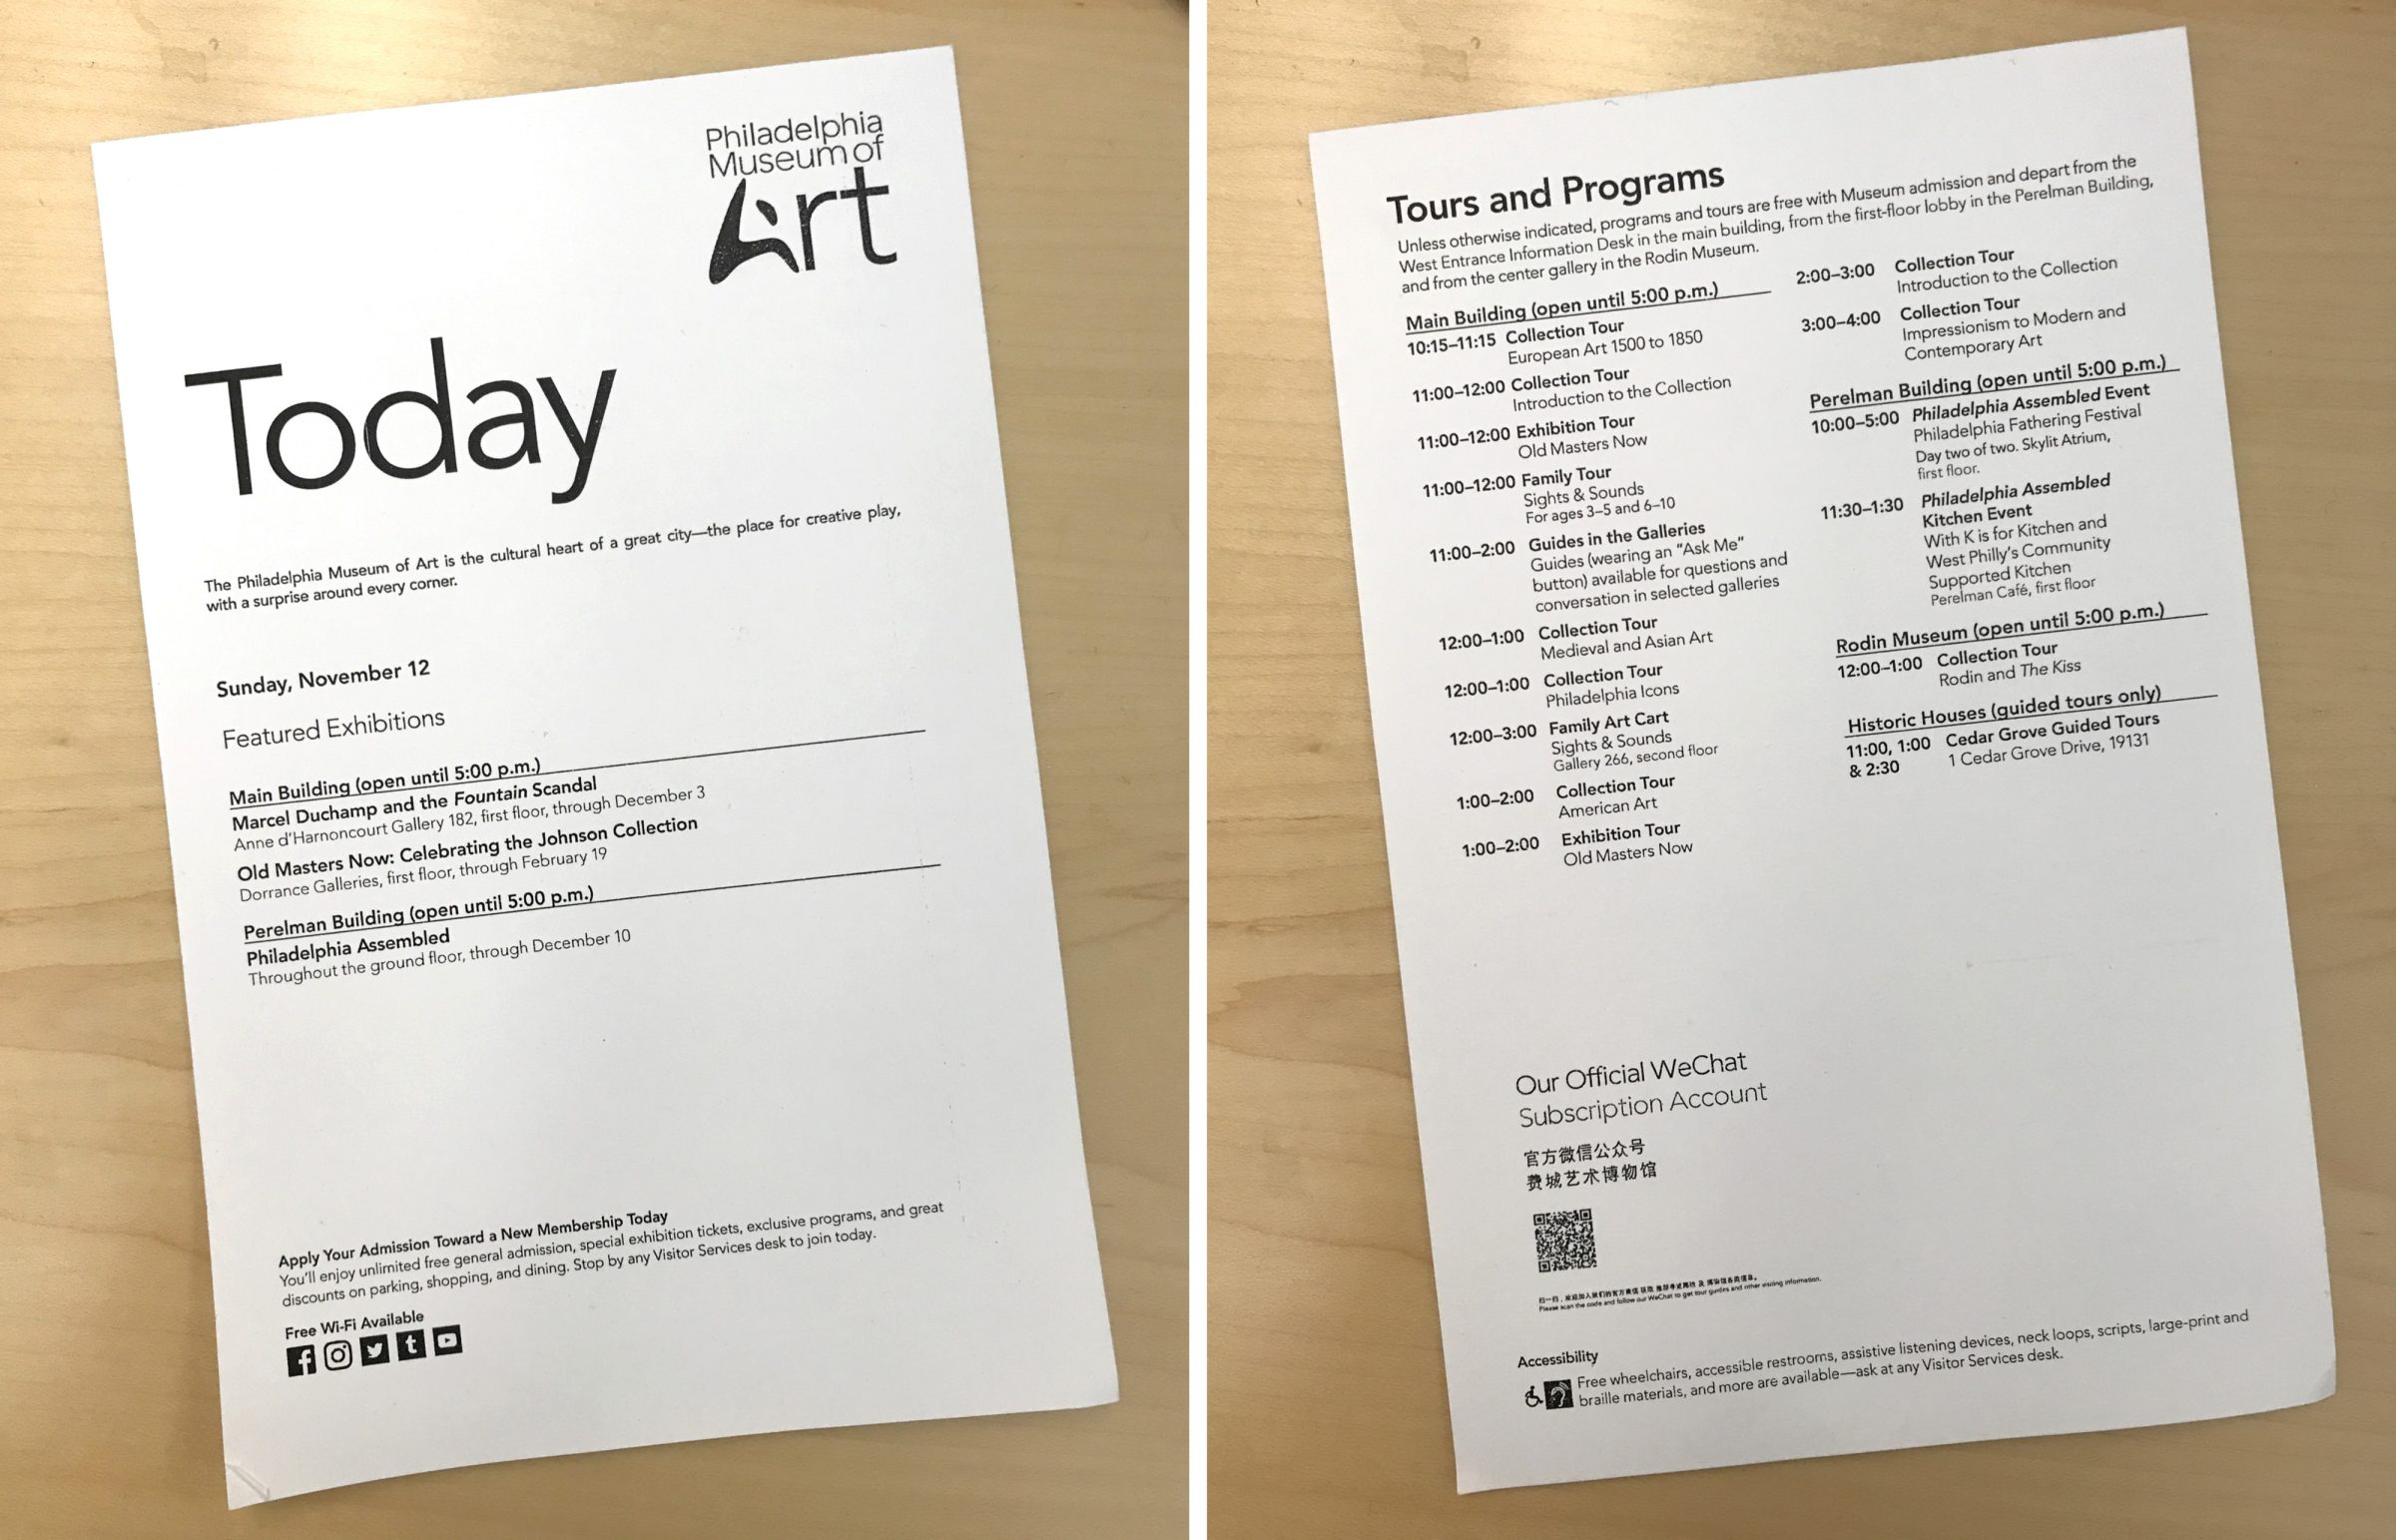
Answering the question “what’s on today?”
A few months ago we launched a new visit planning feature on whitney.org. Varyingly referred to internally as “Today at the Whitney” or “What’s on Today”, this feature came about after a conversation with a number of our colleagues in Visitor Services around our Plan Your Visit and Events calendar pages. They brought up how difficult it can be for visitors to get a good view “at a glance” of what all is happening at the Whitney on a given day, and wondered if there was a way we could better serve this need on whitney.org. To anyone who’s visited museums and their websites, this is likely a familiar problem…
-

Experimenting with what works
A lot has changed about whitney.org over the last year. This includes the entire platform underpinning the site, and a number of major usability and user interface improvements, from reworked navigation, to new mobile experiences for audio and video, to the incorporation of outside voices in our exhibition content. And with growing distance from the complexities of launching a new website, our data-related work has been picking up steam as we’ve been able to devote more time and mindshare to it, which in turn has begun to more deeply impact our design thinking and decision making processes. A major aspect of that impact is in an increasing ability to reevaluate our assumptions, and to better understand how visitors are actually interacting with us…rather than just how we might think they are…
-
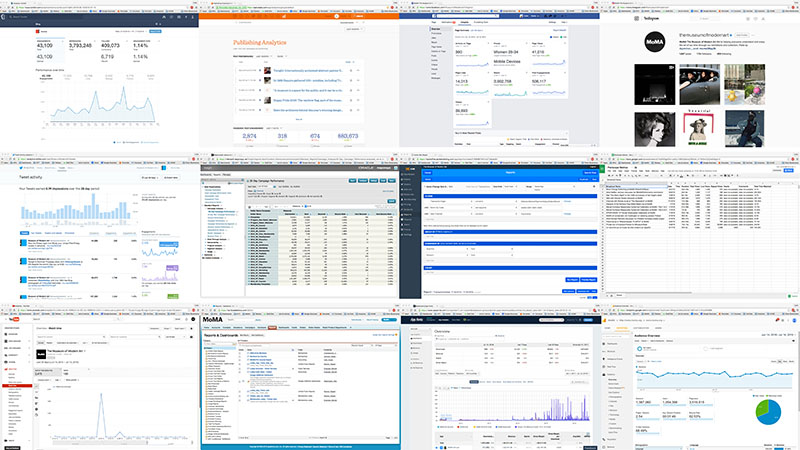
“Hey could you give me the numbers on that again?”
Interning with MoMA’s Digital Media department is great. Building a dashboard to track metrics across the museum is really complicated. Both of these statements are true, which is the kind of authoritative certainty I strive for in data analytics. This summer my job has been to create a dynamic dashboard that pulls in data from sources all over MoMA, that ideally updates automatically…